
I downloaded my data from Facebook in a .json format. I used Python with Jupyter Notebook to play with data.
The json and pandas libraries are very useful to read and display data in a stylized way.
I added some columns to the data such as date (since the available time was a millisecond timestamp) and total characters for each row (each row represents a sent message).
Finally, I exported the data as an .xls file and opened it with Tableau to make the graphs.
# data time range : 2010-10-24 to 2019-07-05
# Imports

import json
import datetime
import matplotlib.pyplot as plt
import seaborn as sns
import pandas as pd
import numpy as np
import operator
fileName = 'message_1.json'
orderedDays = ['Monday', 'Tuesday', 'Wednesday', 'Thursday', 'Friday', 'Saturday', 'Sunday']
with open(fileName) as jsonFile:
    data = json.load(jsonFile)
    dataList = []
    words = {}
    for index, message in enumerate(data['messages']):
        row = []
        row.append('Me' if message["sender_name"] == 'Mokhles Bouzaien' else 'Her')
        row.append(message['timestamp_ms'])
        try:
            row.append(message['content'])
        except KeyError:
            row.append(None)

        try:
            wordList = message["content"].split()
        except KeyError:
            pass

        for word in wordList:
            try:
                words[word] += 1
            except KeyError:
                words[word] = 1

        dataList.append(row)
dataList = np.array(dataList)
df = pd.DataFrame(dataList,columns=['sender', 'timestamp_ms', 'content'])
df['date'] = df.apply(lambda row: datetime.date.fromtimestamp(row.timestamp_ms / 1000), axis = 1)
df['year'] = df.apply(lambda row: datetime.date.fromtimestamp(row.timestamp_ms / 1000).year, axis = 1)
df['month'] = df.apply(lambda row: datetime.date.fromtimestamp(row.timestamp_ms / 1000).month, axis = 1)
df['day'] = df.apply(lambda row: datetime.date.fromtimestamp(row.timestamp_ms / 1000).day, axis = 1)
df['weekday'] = df.apply(lambda row: datetime.date.fromtimestamp(row.timestamp_ms / 1000).strftime('%A'), axis = 1)
df['hour'] = df.apply(lambda row: datetime.datetime.fromtimestamp(row.timestamp_ms / 1000).hour, axis = 1)
df['caracters'] = df.apply(lambda row: len(row.content) if row.content != None else 0, axis = 1)
df.head()
| sender | timestamp_ms | content | date | year | month | day | weekday | hour | caracters |
|---|
| 0 | Her | 1562350465800 | Hidden Message | 2019-07-05 | 2019 | 7 | 5 | Friday | 20 | 51 |
|---|
| 1 | Her | 1562350430104 | Hidden Message | 2019-07-05 | 2019 | 7 | 5 | Friday | 20 | 33 |
|---|
| 2 | Her | 1562350413998 | Hidden Message | 2019-07-05 | 2019 | 7 | 5 | Friday | 20 | 43 |
|---|
| 3 | Me | 1562350377019 | Hidden Message | 2019-07-05 | 2019 | 7 | 5 | Friday | 20 | 12 |
|---|
| 4 | Me | 1562350371595 | Hidden Message | 2019-07-05 | 2019 | 7 | 5 | Friday | 20 | 8 |
|---|
# Data is exported as .slsx file and imported to Tableau
df.to_excel("output.xlsx", engine='xlsxwriter')


sortedWords = sorted(words.items(), key=operator.itemgetter(1), reverse=True)
# group data by sender
dfBySender = df.groupby('sender')['caracters'].agg(['sum', 'count'])
# dfBySender = pd.DataFrame(dfBySender).reset_index()
dfBySender.head()
| sum | count |
|---|
| sender | | |
|---|
| Her | 6351619 | 210679 |
|---|
| Me | 2953745 | 152407 |
|---|
# dfBySender.plot.pie(y='count', figsize=(5, 5))

# group data by date
dfByDate = df.groupby('date')['caracters'].agg(['sum', 'count'])
dfByDate.head()
| sum | count |
|---|
| date | | |
|---|
| 2010-10-24 | 43 | 2 |
|---|
| 2010-10-26 | 9 | 1 |
|---|
| 2010-10-27 | 13 | 1 |
|---|
| 2010-12-17 | 19 | 1 |
|---|
| 2011-03-31 | 16 | 5 |
|---|
print(dfByDate.loc[dfByDate['sum'].idxmax()])
print(dfByDate.loc[dfByDate['count'].idxmax()])
print(dfByDate['sum'].mean())
print(dfByDate['count'].mean())
sum      36354
count      346
Name: 2012-07-23, dtype: int64
sum      22975
count     1171
Name: 2018-08-20, dtype: int64
3553.0217640320734
138.63535700649103
# plt.figure(figsize=(16,12))
# dfByDate['sum'].plot()
# plt.figure(figsize=(16,12))
# dfByDate['count'].plot()
# plt.figure(figsize=(16,6))
# plt.subplot(121)
# dfByDate.cumsum()['sum'].plot()
# plt.subplot(122)
# dfByDate.cumsum()['count'].plot()

# group data by month
dfByMonth = df.groupby(['year','month'])['caracters'].agg(['sum', 'count'])
dfByMonth = dfByMonth.reset_index()
dfByMonth.head()
| year | month | sum | count |
|---|
| 0 | 2010 | 10 | 65 | 4 |
|---|
| 1 | 2010 | 12 | 19 | 1 |
|---|
| 2 | 2011 | 3 | 16 | 5 |
|---|
| 3 | 2011 | 7 | 2039 | 154 |
|---|
| 4 | 2011 | 8 | 177 | 22 |
|---|
# sns.set()
# caracters = dfByMonth.pivot("month", "year", "sum")
# messages = dfByMonth.pivot("month", "year", "count")
# f, ax = plt.subplots(figsize=(16, 12))
# sns.heatmap(caracters, annot=False, ax=ax, cmap='YlGnBu')
# f, ax = plt.subplots(figsize=(16, 12))
# sns.heatmap(messages, annot=False, ax=ax, cmap='YlGnBu')

# group data by year
dfByYear = df.groupby('year')['caracters'].agg(['sum', 'count'])
dfByYear = pd.DataFrame(dfByYear).reset_index()
dfByYear.head()
| year | sum | count |
|---|
| 0 | 2010 | 84 | 5 |
|---|
| 1 | 2011 | 180787 | 6445 |
|---|
| 2 | 2012 | 1976590 | 53485 |
|---|
| 3 | 2013 | 817978 | 26960 |
|---|
| 4 | 2014 | 698706 | 22401 |
|---|

# group data by weekday
dfByWeekday = df.groupby('weekday')['caracters'].agg(['sum', 'count'])
dfByWeekday = dfByWeekday.reindex(orderedDays)
dfByWeekday = dfByWeekday.reset_index()
dfByWeekday
| weekday | sum | count |
|---|
| 0 | Monday | 1383277 | 52854 |
|---|
| 1 | Tuesday | 1269405 | 50000 |
|---|
| 2 | Wednesday | 1248049 | 48457 |
|---|
| 3 | Thursday | 1179119 | 46607 |
|---|
| 4 | Friday | 1387426 | 54655 |
|---|
| 5 | Saturday | 1237290 | 49303 |
|---|
| 6 | Sunday | 1600798 | 61210 |
|---|
# # group data by date and weekday
# dfByDateWeekday = df.groupby(['date', 'weekday'])['caracters'].agg(['sum', 'count'])
# dfByDateWeekday = dfByDateWeekday.reset_index()
# dfByDateWeekday.head()

# sns.catplot(x="weekday", y="count", order=orderedDays, data=dfByDateWeekday, height=12)
# sns.catplot(x="weekday", y="count", order=orderedDays, kind='bar', data=dfByWeekday, height=12)
# sns.boxplot(x="weekday", y="count", data=dfByDateWeekday)
# group data by hour
dfByHour = df.groupby('hour')['caracters'].agg(['sum', 'count'])
dfByHour = dfByHour.reset_index()
dfByHour.head()
| hour | sum | count |
|---|
| 0 | 0 | 629842 | 26814 |
|---|
| 1 | 1 | 410867 | 17451 |
|---|
| 2 | 2 | 239291 | 9799 |
|---|
| 3 | 3 | 176846 | 7712 |
|---|
| 4 | 4 | 123076 | 5105 |
|---|
# dfByHour['count'].plot.bar()

Reddit Post: https://www.reddit.com/r/dataisbeautiful/comments/caa9il/more_than_8_years_of_messages_between_my/
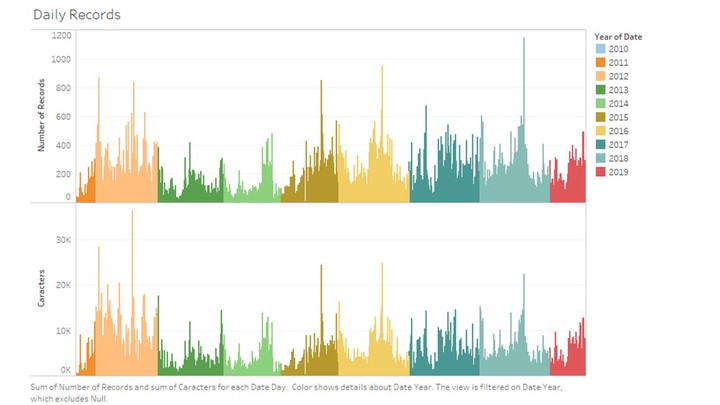 Total messages by Day